I rerun the load testing, there were 3 storage processes with higher queue size in the beginning, but this time the third largest queue size shrink pretty soon. In storage processes input_bytes.hz, after running for a while, they basically form in 3 groups. The first group (~= 15MB/s one) are the 3 processes with higher queue size in the beginning. For other metrics you mentioned, all processes emitting metrics in similar range.
However, even if I know these 3 processes write more data than the other processes, how am I going from that? That 15MS/s is way lower than each underlying SSD’s capability, and they are the only one process writing to their own disk.
Our implementation didn’t use tuple layer but directly use byte array as key. For example our s key have 4 segments ('s', 2 bytes of hash(key), 4 bytes of timestamp, key), we use the concatenation of bytes representation of each segment as the FoundationDB key.
Does this consider as “different key spaces” or all are in one key space?
Basically “stored_bytes” are never imbalanced from the beginning till 2 or 3 storage processes storage queues are way behind during my load testing. Do I still need to pre-load data?
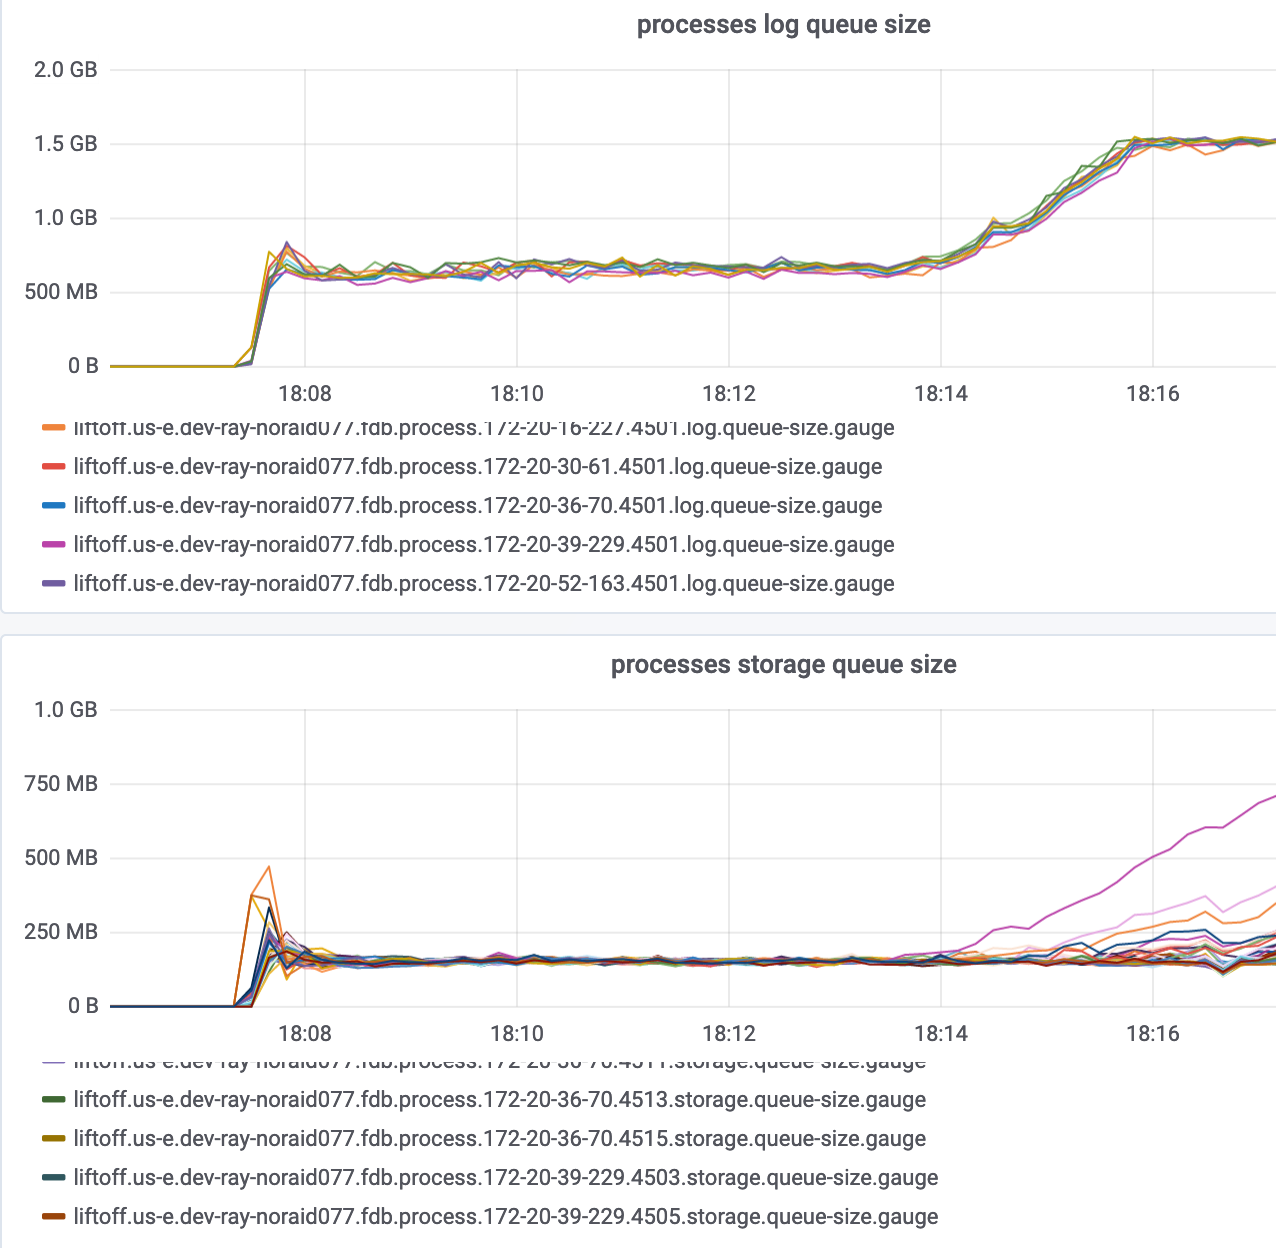
I’ve been helping Ray debug this. We’ve managed to simplify the problem considerably. We can reproduce it by writing fully random keys (no reads, no prefixes) at a high rate (saturating FDB, so about ~50-100kps) for about 6-7 minutes. Following that, FoundationDB’s log queue size spikes, storage queue size diverges (different processes having wildly different sizes), and throughput drops.
Here’s 3 i3.16xlarge instances running at 1x redundancy. (A single instance had its log queue instantly maxed out, which didn’t allow us to demonstrate this odd divergence behavior).
Here’s 10 i3.16x large instances running at 1x redundancy. This is stable, suggesting that the problems we’re observing have something to do with the ratio of total machine/disk count to workload. However, I still don’t fully understand what’s happening.
My current best guess is that there’s some kind of cleanup or other secondary work being done after that 6-7 minute mark, which causes the load on the log processes to exceed its handling capacity. I’m not clear on what that would be, however.
I assume in the evaluation, the tLog and storage server uses different SSDs. In other words, a SSD won’t be shared by tLog and storage server processes. Is that correct?
That’s correct! Each machine has 8 SSDs, and only one stateful process is assigned to each disk, so there’s no disk sharing between log and storage processes.
If it would be helpful, I can try to clean up our load generation code to make it easier to repro. I can also share any other metrics that’d be useful.
I think the log queues are growing here because the storage queues are. This is because anything in flight on the storage servers is as in flight on the logs (the logs can’t remove data from their queues until the storage servers that need that data have made it durable).
My guess at the diverging behavior is that each of the processes is experiencing roughly the same problem, but with slight variations in rate and start time. Depending on your configuration, some number of storage queues will reach ~1GB and then level off as ratekeeper kicks in. Any storage server that’s doing a little bit better than the limiting storage server will likely then have its queue fall back down since it’s able to do just a bit more than is required of it.
The remaining question is why your disks suddenly can’t keep up after several minutes of running. One possibility is that this is a property of the disk, for example due to SSD garbage collection starting after a while. We’ve seen many cases of disks behaving markedly worse after periods of sustained load, and that explanation would match the behavior here reasonably well. How busy are the disks during your test?
If you are starting the test from an empty or small database, it may also be possible that the performance regime changes as your b-tree gets larger than cache, resulting in an increased number of reads going to disk (I’m assuming the ssd storage engine). It feels a little bit like that should appear as a more gradual degradation, but maybe not. If you are running your tests from empty, you could potentially eliminate this effect by pre-loading your database to a decent size. You could also limit the writes in your test to existing keys, in which case the database shouldn’t change in size so long as your value sizes are similar.
Nothing else immediately comes to mind to explain why performance would degrade over time. Assuming the problem isn’t something bad going on in the cluster, the resolution to this is likely going to be that you’ll either need to decrease your load or increase your computing resources. It seems like the storage servers do ok at 1/3 load (from the 10 instance 1x redundancy test), so running 30 instances at 3x redundancy seems likely to work.
The remaining question is why your disks suddenly can’t keep up after several minutes of running. One possibility is that this is a property of the disk, for example due to SSD garbage collection starting after a while. We’ve seen many cases of disks behaving markedly worse after periods of sustained load, and that explanation would match the behavior here reasonably well. How busy are the disks during your test?
We see per-disk writes on the order of 20-40kbps. Per Amazon’s specs, the i3.16xlarge instance should support 1.4M IOPS, so we’re almost two orders of magnitude below the listed performance limits (if I’m reading them correctly).
If you are starting the test from an empty or small database, it may also be possible that the performance regime changes as your b-tree gets larger than cache, resulting in an increased number of reads going to disk (I’m assuming the ssd storage engine).
This is a very good suggestion. After my last post, we discovered that performance instantly diverged when we ran on a “pre-loaded” database, rather than taking several minutes / ~20GB of stored data first. This makes your hypothesis seem quite likely.
We’re currently doing tests on scaling, to confirm that adding more machines increases our throughput. (Earlier tests were inconclusive.) I’ll post again once that’s done.
That 1.4M number has a few large caveats. To be brief, you’ll need somewhere in the realm of 128-256 parallel writers evenly spread across all the disks to get that much throughput (queue depth 16-32 on each disk).
Right now you have a total of ~28 storage processes on each i3.16xlarge. That would put you at queue depth 3-4 on each device, which extrapolated linearly from the advertised peak is 15-30% available write IOPS.
It also doesn’t say much for what the latency on those writes are when you reach that peak. The QoS you need could be out of reach at that throughput.
Summing the space used by each storage process would tell you this unless I’m missing another file storage processes create which is counted in this metric but is not the b-tree.
It should just be the b-tree file and the WAL (write-ahead log), which I think generally doesn’t get too big.
A couple other things you could potentially look at to see how it changes during your test:
The on-disk overhead (kvstore_used_bytes / stored_bytes for a storage server). The overhead tends to go up a little bit over time as the b-tree gets mutated because some of the pages start getting a bit emptier, etc.
The cache hit rate (this is not currently available in status, but I think it’s roughly something like (CacheReads-FileReads) / CacheReads from the ProcessMetrics event in the trace logs).
Ray and I have spent the last few days looking at resource consumption. My earlier numbers for IOPS were wrong (I was looking at the wrong graph). Instead, it seems like we’re writing about 800k IOPS across all processes, ie 80k/instance. That’s only about 6% of the advertised write throughput for i3.16xlarge instances, which seems quite remarkable.
Furthermore, though overall machine CPU usage is quite low (making this subtler), our log processes all claim 90-100% CPU usage. This is true for most of the permutations we’ve tried so far (with 1-5 log processes per machine and (8 - log) storage processes each), suggesting we may actually be CPU limited; testing is slow but I’m planning to try significantly higher number of log processes next.
I still also want to look at the metrics which @ajbeamon mentioned - will report back once I do.
I’ve cleaned up our load testing code a bit to show what we’re doing to generate load - here it is. Perhaps it’ll be helpful.
We suspected that some kind of global lock in the FoundationDB client might limit throughput, and so experimented with having one FDB client per goroutine in the load generator. This did increase throughput, but not dramatically.