Continous growth of Redwood disk usage with no client connected, possible bug?

7.1.25:

I had a single instance cluster with 6.8 GB data and SSD storage engine configured. There were no clients connected, and the used space was constant over time:

  Sum of key-value sizes - 6.800 GB
  Disk space used        - 8.409 GB

Then the cluster was reconfigured using configure ssd-redwood-1-experimental storage_migration_type=aggressive.

After the data migration completed, the storage_migration_type was disabled, and redwood compressed a lot of keys impressively:

  Sum of key-value sizes - 6.800 GB
  Disk space used        - 6.501 GB

However, with no clients connected and no backups running, the database grew slowly but steadily:

  02:00:
  Sum of key-value sizes - 6.800 GB
  Disk space used        - 6.504 GB
  
  11:00:
  Sum of key-value sizes - 6.800 GB
  Disk space used        - 6.842 GB

  13:00:
  Sum of key-value sizes - 6.800 GB
  Disk space used        - 6.922 GB

So the disk space grew by 10% in 12 hours.

I could replicate the issue on a linux server, a windows desktop and a docker container too. Is this a redwood bug?

It’s not a bug. Each Redwood instance will accumulate up to 4GB (configurable, this is the default) of page updates that haven’t been flush to their primary page location. This flushing is done when the page update rolls off of the 4GB window, and is skipped if another update for that page exists further down in the window. This design is to save write ops and associated overheads, but at the cost of disk space. The feature is controlled by the REDWOOD_REMAP_CLEANUP_WINDOW_BYTES knob and you can set it to 0.

Related to this, Redwood files do not shrink, instead freed pages are maintained in internal free lists and reused. This is also a design decision to reduce IO and CPU overhead, as maintaining the necessary metadata to shrink files is expensive and normally in a performance focused deployment FDB would be given dedicated disks.

Thank you, the constant size optimization makes sense. However, I configured one of our test servers, and let it run, but it overshot the 4GB default limit, and size is still increasing, see image below:

(ignore the drops to zero, those are server restarts)

The size of key-values in fairly constant, and now the size of the DB is twice the size of the test data.

The server has 2 types of workloads:

  • Frequently: Insert immutable records, keep them for 2 days, delete older than 2 days records in ranges every 1 minute. hundreds to a thousand rows per second.
  • Infrequently: Update the same 50 records about 20 times in 5 minutes, then keep them forever unchanged, move to the next 50 records.

What other factors may be at play here?

It doesn’t sound like your workload would be generating a lot of page slack.

Redwood logs a bunch of histograms, can you check your trace logs for the following?

Type=Histogram Group=modifyFillPct Op=L1
Type=Histogram Group=buildFillPct Op=L1

Each logged event covers a 30 second period and shows bucket counts for fill percentages (100% = 1.0) for updated leaf pages and newly built leaf pages generated from page splits, respectively.

Also, what do you see in Type=StorageMetrics events for the fields

KvstoreBytesUsed
KvstoreBytesFree
KvstoreBytesAvailable
KvstoreBytesTotal
KvstoreBytesTemp

Also, can you restart your StorageServer process and post these events?

Type=RedwoodRecoveredPager
Type=RedwoodRecoveredBTree

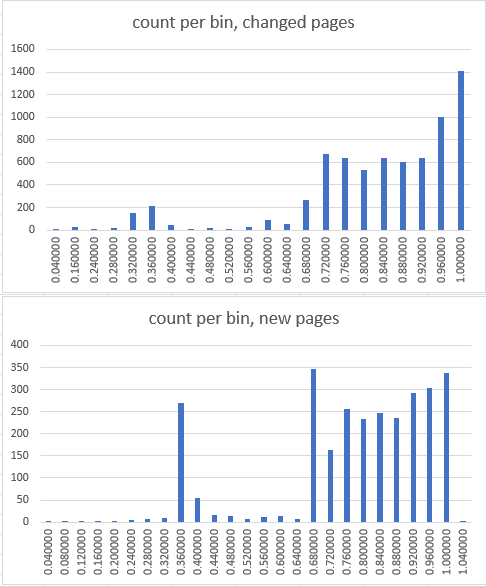
Thank you, the changed and new pages per bin (raw data below):

This is from a new experiment that is barely above the 4 GB optimization overhead, as I had to convert back to SSD due to the size growth. I even tried to backup, delete the FDB installation (as it was updated from 6.3 to 7.1), install 7.1 and restore. The size of raw data (k+v ) is reported as 6.3 GB.

After server restart:

<Event Severity="10" Time="1669196660.889803" DateTime="2022-11-23T09:44:20Z" Type="RedwoodRecoveredBTree" ID="0000000000000000" FileName="/var/lib/foundationdb/data/4500/storage-f87bfbd4641191514656a281b157560d.redwood-v1"
OpenedExisting="1" 
LatestVersion="166473" 
LazyClearQueueRecords="0" 
LazyClearQueuePages="1" 
LazyClearQueueRecordsPerPage="0" 
ThreadID="11653865267480727846" Machine="127.0.0.1:4500" LogGroup="default" Roles="SS" />


<Event Severity="10" Time="1669196660.889803" DateTime="2022-11-23T09:44:20Z" Type="RedwoodRecoveredPager" ID="0000000000000000" 
OpenedExisting="1" FileName="/var/lib/foundationdb/data/4500/storage-f87bfbd4641191514656a281b157560d.redwood-v1" 
LogicalFileSize="13747232768" 
PhysicalFileSize="13762560000" 
CommittedVersion="166473" 
LogicalPageSize="8192" 
PhysicalPageSize="8192" 
RemapQueueRecords="498249" 
RemapQueuePages="1906" 
RemapQueueRecordsPerPage="261.411" 
FreeQueueRecords="2137" 
FreeQueuePages="19" 
FreeQueueRecordsPerPage="112.474" 
DelayedFreeQueueRecords="81" 
DelayedFreeQueuePages="2" 
DelayedFreeQueueRecordsPerPage="40.5" 
UsedExtentQueueRecords="2" 
UsedExtentQueuePages="3" 
UsedExtentQueueRecordsPerPage="0.666667" 
FreeExtentQueueRecords="2" 
FreeExtentQueuePages="3" 
FreeExtentQueueRecordsPerPage="0.666667" 
StorageBytesUsed="13728890880" 
StorageBytesTemp="4081655808" 
StorageBytesTotal="51835101184" 
StorageBytesFree="31935422464" 
StorageBytesAvailable="31953764352" 
ThreadID="11653865267480727846" Machine="127.0.0.1:4500" LogGroup="default" Roles="SS" />

Raw data:

<Event Severity="10" Time="1669195789.951340" DateTime="2022-11-23T09:29:49Z" Type="Histogram" ID="0000000000000000" Group="modifyFillPct" Op="L1" Unit="percentage" Elapsed="30.0042" LessThan0.040000="1" LessThan0.160000="29" LessThan0.240000="3" LessThan0.280000="20" LessThan0.320000="151" LessThan0.360000="210" LessThan0.400000="43" LessThan0.440000="9" LessThan0.480000="22" LessThan0.520000="13" LessThan0.560000="29" LessThan0.600000="88" LessThan0.640000="51" LessThan0.680000="266" LessThan0.720000="675" LessThan0.760000="643" LessThan0.800000="533" LessThan0.840000="638" LessThan0.880000="599" LessThan0.920000="640" LessThan0.960000="999" LessThan1.000000="1405" TotalCount="7067" ThreadID="2558203997968097348" Machine="127.0.0.1:4500" LogGroup="default" Roles="CC,CD,CP,DD,GP,MS,RK,RV,SS,TL" />
<Event Severity="10" Time="1669195819.951355" DateTime="2022-11-23T09:30:19Z" Type="Histogram" ID="0000000000000000" Group="modifyFillPct" Op="L1" Unit="percentage" Elapsed="30" LessThan0.040000="1" LessThan0.160000="1" LessThan0.200000="19" LessThan0.240000="3" LessThan0.280000="18" LessThan0.320000="140" LessThan0.360000="173" LessThan0.400000="29" LessThan0.440000="11" LessThan0.480000="18" LessThan0.520000="16" LessThan0.560000="19" LessThan0.600000="81" LessThan0.640000="51" LessThan0.680000="266" LessThan0.720000="660" LessThan0.760000="596" LessThan0.800000="549" LessThan0.840000="586" LessThan0.880000="615" LessThan0.920000="565" LessThan0.960000="894" LessThan1.000000="1170" TotalCount="6481" ThreadID="2558203997968097348" Machine="127.0.0.1:4500" LogGroup="default" Roles="CC,CD,CP,DD,GP,MS,RK,RV,SS,TL" />
<Event Severity="10" Time="1669195849.951426" DateTime="2022-11-23T09:30:49Z" Type="Histogram" ID="0000000000000000" Group="modifyFillPct" Op="L1" Unit="percentage" Elapsed="30.0001" LessThan0.040000="1" LessThan0.160000="53" LessThan0.240000="8" LessThan0.280000="26" LessThan0.320000="159" LessThan0.360000="253" LessThan0.400000="35" LessThan0.440000="9" LessThan0.480000="17" LessThan0.520000="25" LessThan0.560000="15" LessThan0.600000="87" LessThan0.640000="56" LessThan0.680000="303" LessThan0.720000="717" LessThan0.760000="638" LessThan0.800000="661" LessThan0.840000="711" LessThan0.880000="726" LessThan0.920000="674" LessThan0.960000="1015" LessThan1.000000="1467" TotalCount="7656" ThreadID="2558203997968097348" Machine="127.0.0.1:4500" LogGroup="default" Roles="CC,CD,CP,DD,GP,MS,RK,RV,SS,TL" />
<Event Severity="10" Time="1669195879.951443" DateTime="2022-11-23T09:31:19Z" Type="Histogram" ID="0000000000000000" Group="modifyFillPct" Op="L1" Unit="percentage" Elapsed="30" LessThan0.040000="1" LessThan0.160000="2" LessThan0.240000="6" LessThan0.280000="21" LessThan0.320000="182" LessThan0.360000="145" LessThan0.400000="21" LessThan0.440000="15" LessThan0.480000="14" LessThan0.520000="23" LessThan0.560000="22" LessThan0.600000="88" LessThan0.640000="57" LessThan0.680000="269" LessThan0.720000="700" LessThan0.760000="659" LessThan0.800000="623" LessThan0.840000="707" LessThan0.880000="666" LessThan0.920000="696" LessThan0.960000="958" LessThan1.000000="1179" TotalCount="7054" ThreadID="2558203997968097348" Machine="127.0.0.1:4500" LogGroup="default" Roles="CC,CD,CP,DD,GP,MS,RK,RV,SS,TL" />
<Event Severity="10" Time="1669195909.952585" DateTime="2022-11-23T09:31:49Z" Type="Histogram" ID="0000000000000000" Group="modifyFillPct" Op="L1" Unit="percentage" Elapsed="30.0011" LessThan0.040000="1" LessThan0.120000="1" LessThan0.160000="1" LessThan0.240000="2" LessThan0.280000="21" LessThan0.320000="207" LessThan0.360000="231" LessThan0.400000="37" LessThan0.440000="13" LessThan0.480000="17" LessThan0.520000="21" LessThan0.560000="21" LessThan0.600000="91" LessThan0.640000="61" LessThan0.680000="296" LessThan0.720000="745" LessThan0.760000="658" LessThan0.800000="623" LessThan0.840000="692" LessThan0.880000="641" LessThan0.920000="608" LessThan0.960000="1022" LessThan1.000000="1412" TotalCount="7422" ThreadID="2558203997968097348" Machine="127.0.0.1:4500" LogGroup="default" Roles="CC,CD,CP,DD,GP,MS,RK,RV,SS,TL" />
<Event Severity="10" Time="1669195939.952603" DateTime="2022-11-23T09:32:19Z" Type="Histogram" ID="0000000000000000" Group="modifyFillPct" Op="L1" Unit="percentage" Elapsed="30" LessThan0.040000="1" LessThan0.160000="1" LessThan0.240000="2" LessThan0.280000="40" LessThan0.320000="173" LessThan0.360000="196" LessThan0.400000="37" LessThan0.440000="9" LessThan0.480000="16" LessThan0.520000="23" LessThan0.560000="10" LessThan0.600000="84" LessThan0.640000="58" LessThan0.680000="264" LessThan0.720000="538" LessThan0.760000="491" LessThan0.800000="505" LessThan0.840000="533" LessThan0.880000="535" LessThan0.920000="534" LessThan0.960000="827" LessThan1.000000="1118" TotalCount="5995" ThreadID="2558203997968097348" Machine="127.0.0.1:4500" LogGroup="default" Roles="CC,CD,CP,DD,GP,MS,RK,RV,SS,TL" />
<Event Severity="10" Time="1669195969.952622" DateTime="2022-11-23T09:32:49Z" Type="Histogram" ID="0000000000000000" Group="modifyFillPct" Op="L1" Unit="percentage" Elapsed="30" LessThan0.040000="2" LessThan0.160000="1" LessThan0.240000="2" LessThan0.280000="20" LessThan0.320000="170" LessThan0.360000="207" LessThan0.400000="48" LessThan0.440000="9" LessThan0.480000="19" LessThan0.520000="19" LessThan0.560000="30" LessThan0.600000="84" LessThan0.640000="57" LessThan0.680000="295" LessThan0.720000="722" LessThan0.760000="635" LessThan0.800000="563" LessThan0.840000="676" LessThan0.880000="708" LessThan0.920000="683" LessThan0.960000="1041" LessThan1.000000="1425" TotalCount="7416" ThreadID="2558203997968097348" Machine="127.0.0.1:4500" LogGroup="default" Roles="CC,CD,CP,DD,GP,MS,RK,RV,SS,TL" />
<Event Severity="10" Time="1669195999.952729" DateTime="2022-11-23T09:33:19Z" Type="Histogram" ID="0000000000000000" Group="modifyFillPct" Op="L1" Unit="percentage" Elapsed="30.0001" LessThan0.040000="1" LessThan0.160000="1" LessThan0.240000="34" LessThan0.280000="17" LessThan0.320000="153" LessThan0.360000="160" LessThan0.400000="33" LessThan0.440000="6" LessThan0.480000="14" LessThan0.520000="17" LessThan0.560000="24" LessThan0.600000="80" LessThan0.640000="44" LessThan0.680000="257" LessThan0.720000="589" LessThan0.760000="549" LessThan0.800000="544" LessThan0.840000="539" LessThan0.880000="641" LessThan0.920000="576" LessThan0.960000="883" LessThan1.000000="1141" TotalCount="6303" ThreadID="2558203997968097348" Machine="127.0.0.1:4500" LogGroup="default" Roles="CC,CD,CP,DD,GP,MS,RK,RV,SS,TL" />
<Event Severity="10" Time="1669196029.954096" DateTime="2022-11-23T09:33:49Z" Type="Histogram" ID="0000000000000000" Group="modifyFillPct" Op="L1" Unit="percentage" Elapsed="30.0014" LessThan0.080000="1" LessThan0.200000="1" LessThan0.240000="7" LessThan0.280000="21" LessThan0.320000="210" LessThan0.360000="223" LessThan0.400000="45" LessThan0.440000="13" LessThan0.480000="16" LessThan0.520000="16" LessThan0.560000="24" LessThan0.600000="102" LessThan0.640000="52" LessThan0.680000="239" LessThan0.720000="606" LessThan0.760000="610" LessThan0.800000="509" LessThan0.840000="557" LessThan0.880000="620" LessThan0.920000="544" LessThan0.960000="874" LessThan1.000000="1334" TotalCount="6624" ThreadID="2558203997968097348" Machine="127.0.0.1:4500" LogGroup="default" Roles="CC,CD,CP,DD,GP,MS,RK,RV,SS,TL" />


<Event Severity="10" Time="1669196389.955369" DateTime="2022-11-23T09:39:49Z" Type="Histogram" ID="0000000000000000" Group="buildFillPct" Op="L1" Unit="percentage" Elapsed="30" LessThan0.040000="2" LessThan0.080000="1" LessThan0.120000="3" LessThan0.160000="3" LessThan0.200000="2" LessThan0.240000="5" LessThan0.280000="7" LessThan0.320000="10" LessThan0.360000="270" LessThan0.400000="54" LessThan0.440000="17" LessThan0.480000="14" LessThan0.520000="7" LessThan0.560000="11" LessThan0.600000="15" LessThan0.640000="7" LessThan0.680000="347" LessThan0.720000="164" LessThan0.760000="255" LessThan0.800000="233" LessThan0.840000="248" LessThan0.880000="236" LessThan0.920000="293" LessThan0.960000="303" LessThan1.000000="338" LessThan1.040000="2" TotalCount="2847" ThreadID="2558203997968097348" Machine="127.0.0.1:4500" LogGroup="default" Roles="CC,CD,CP,DD,GP,MS,RK,RV,SS,TL" />
<Event Severity="10" Time="1669196419.956688" DateTime="2022-11-23T09:40:19Z" Type="Histogram" ID="0000000000000000" Group="buildFillPct" Op="L1" Unit="percentage" Elapsed="30.0013" LessThan0.120000="1" LessThan0.200000="2" LessThan0.240000="3" LessThan0.280000="3" LessThan0.320000="12" LessThan0.360000="281" LessThan0.400000="65" LessThan0.440000="17" LessThan0.480000="19" LessThan0.520000="7" LessThan0.560000="8" LessThan0.600000="6" LessThan0.640000="13" LessThan0.680000="353" LessThan0.720000="190" LessThan0.760000="250" LessThan0.800000="246" LessThan0.840000="237" LessThan0.880000="255" LessThan0.920000="277" LessThan0.960000="284" LessThan1.000000="315" LessThan1.040000="1" TotalCount="2845" ThreadID="2558203997968097348" Machine="127.0.0.1:4500" LogGroup="default" Roles="CC,CD,CP,DD,GP,MS,RK,RV,SS,TL" />
<Event Severity="10" Time="1669196449.956706" DateTime="2022-11-23T09:40:49Z" Type="Histogram" ID="0000000000000000" Group="buildFillPct" Op="L1" Unit="percentage" Elapsed="30" LessThan0.040000="3" LessThan0.080000="3" LessThan0.120000="3" LessThan0.160000="3" LessThan0.200000="6" LessThan0.240000="3" LessThan0.280000="4" LessThan0.320000="19" LessThan0.360000="239" LessThan0.400000="67" LessThan0.440000="11" LessThan0.480000="17" LessThan0.520000="7" LessThan0.560000="10" LessThan0.600000="12" LessThan0.640000="4" LessThan0.680000="310" LessThan0.720000="196" LessThan0.760000="261" LessThan0.800000="234" LessThan0.840000="244" LessThan0.880000="271" LessThan0.920000="283" LessThan0.960000="263" LessThan1.000000="327" TotalCount="2800" ThreadID="2558203997968097348" Machine="127.0.0.1:4500" LogGroup="default" Roles="CC,CD,CP,DD,GP,MS,RK,RV,SS,TL" />
<Event Severity="10" Time="1669196479.956742" DateTime="2022-11-23T09:41:19Z" Type="Histogram" ID="0000000000000000" Group="buildFillPct" Op="L1" Unit="percentage" Elapsed="30" LessThan0.040000="1" LessThan0.080000="3" LessThan0.120000="1" LessThan0.160000="3" LessThan0.200000="1" LessThan0.240000="3" LessThan0.280000="5" LessThan0.320000="13" LessThan0.360000="260" LessThan0.400000="82" LessThan0.440000="7" LessThan0.480000="19" LessThan0.520000="6" LessThan0.560000="11" LessThan0.600000="10" LessThan0.640000="13" LessThan0.680000="354" LessThan0.720000="155" LessThan0.760000="233" LessThan0.800000="300" LessThan0.840000="257" LessThan0.880000="252" LessThan0.920000="259" LessThan0.960000="285" LessThan1.000000="347" TotalCount="2880" ThreadID="2558203997968097348" Machine="127.0.0.1:4500" LogGroup="default" Roles="CC,CD,CP,DD,GP,MS,RK,RV,SS,TL" />
<Event Severity="10" Time="1669196509.956984" DateTime="2022-11-23T09:41:49Z" Type="Histogram" ID="0000000000000000" Group="buildFillPct" Op="L1" Unit="percentage" Elapsed="30.0002" LessThan0.040000="2" LessThan0.080000="2" LessThan0.120000="1" LessThan0.160000="2" LessThan0.200000="4" LessThan0.240000="5" LessThan0.280000="7" LessThan0.320000="19" LessThan0.360000="246" LessThan0.400000="73" LessThan0.440000="12" LessThan0.480000="17" LessThan0.520000="6" LessThan0.560000="8" LessThan0.600000="6" LessThan0.640000="3" LessThan0.680000="328" LessThan0.720000="180" LessThan0.760000="251" LessThan0.800000="272" LessThan0.840000="252" LessThan0.880000="258" LessThan0.920000="278" LessThan0.960000="277" LessThan1.000000="335" LessThan1.040000="1" TotalCount="2845" ThreadID="2558203997968097348" Machine="127.0.0.1:4500" LogGroup="default" Roles="CC,CD,CP,DD,GP,MS,RK,RV,SS,TL" />
<Event Severity="10" Time="1669196539.957032" DateTime="2022-11-23T09:42:19Z" Type="Histogram" ID="0000000000000000" Group="buildFillPct" Op="L1" Unit="percentage" Elapsed="30" LessThan0.040000="1" LessThan0.080000="1" LessThan0.120000="2" LessThan0.160000="1" LessThan0.200000="1" LessThan0.240000="1" LessThan0.280000="4" LessThan0.320000="13" LessThan0.360000="289" LessThan0.400000="64" LessThan0.440000="7" LessThan0.480000="16" LessThan0.520000="5" LessThan0.560000="11" LessThan0.600000="8" LessThan0.640000="5" LessThan0.680000="360" LessThan0.720000="191" LessThan0.760000="233" LessThan0.800000="235" LessThan0.840000="229" LessThan0.880000="274" LessThan0.920000="269" LessThan0.960000="304" LessThan1.000000="322" LessThan1.040000="1" TotalCount="2847" ThreadID="2558203997968097348" Machine="127.0.0.1:4500" LogGroup="default" Roles="CC,CD,CP,DD,GP,MS,RK,RV,SS,TL" />

Thanks.

All of the queue stats in the Recovered messages look fine (I was looking for large amounts of slack space in Pager internal structures).

Looking at your StorageBytes event, at that time your .redwood-v1 file should be about 13.75 GB. Internally it contains about 20MB of free blocks and free block metadata, and then 4081MB of updated pages in the pager remap window. The remap queue itself which describes those page updates is located in bulk allocated blocks called “extents” and there are 4 of those totally 128MB (they are 32MB each by default).

Subtracting out the already-free space and the overheads (which are fairly constant as the structure grows but significant at these small sizes) this leaves about 9522MB of space being used to store your data. If the average page of user data has 33% unused slack and we ignore KV record overhead of the internal searchable page structure then the implied user Key+Value bytes would be 9522 * .66 = 6284MB which is approximately what you are seeing with 6.3GB.

A total slack+overhead of 33% isn’t unreasonable for a BTree, and also it happens to be Redwood’s default “page rebuild max slack” which is controlled by a knob REDWOOD_PAGE_REBUILD_MAX_SLACK. This value is used when updates to a BTree node result in more data than the node can hold. This triggers a node Rebuild, which will produce 1 or more nodes containing the updated data set. This is “1 or more” because BTree nodes in Redwood can be larger than 1 page, and one reason to do this is if a single multi-page node would have less slack than multiple single-page nodes. For example, if many of your KV records are 4500 bytes each and you are using 8k pages then 1 BTree Node = 1 Page would often result in about 55% slack when several of these large records exist under adjacent keys. Instead, with a default max slack of 0.33, Redwood would create 2-page Nodes with size 2 * 8k = 16384 because then 3 adjacent records totaling 13500 bytes can fit in this larger node with only 18% slack (< 33%) instead of 55% if the records were in separate 1-page Nodes.

Can you also plot the Histograms for buildStoredPct and modifyStoredPct also at L1 (leaf level)? This is a percentage calculated as (user Key + Value bytes in page) / (Page Size). In contrast, filled percentage counts (total node structure overhead + user KV bytes) / total node capacity and there are some details this will miss, for example a node update to delete a KV record does not change the filled percentage because the node structure is not rewritten to remove the record immediately, it’s simply marked as deleted via an existing bit (and its key bytes still participate in decompression) but the deletion will cause the user KV bytes for the node to decrease by the size of the deleted record.

Based on all the above I would expect your disk footprint to level off very soon after the end of your plot. If it hasn’t, can you do another restart and post the Recovered events?

The size increased stopped after the restart you suggested:

Before the restart, the leaf stats were:

I’m not sure if the new restart was the cause of the stop of the increase, or it was a coincidence.
Subtracting 5GB of optimization and buffers, This gives a 50% page slack, and that includes the high compressability of my keys. Do the bin distributions give you a hint why this might be?

After the restart, the recovery logs and a sample redwood log:

<Event Severity="10" 
Time="1669290548.238945" 
DateTime="2022-11-24T11:49:08Z" 
Type="RedwoodRecoveredBTree" 
ID="0000000000000000" 
FileName="/var/lib/foundationdb/data/4500/storage-f87bfbd4641191514656a281b157560d.redwood-v1" 
OpenedExisting="1" 
LatestVersion="353009" 
LazyClearQueueRecords="0" 
LazyClearQueuePages="1" 
LazyClearQueueRecordsPerPage="0" 
ThreadID="4701254271508448680" 
Machine="127.0.0.1:4500" 
LogGroup="default" Roles="SS" />

<Event Severity="10" 
Time="1669290548.238945" 
DateTime="2022-11-24T11:49:08Z" 
Type="RedwoodRecoveredPager" 
ID="0000000000000000" 
OpenedExisting="1" 
FileName="/var/lib/foundationdb/data/4500/storage-f87bfbd4641191514656a281b157560d.redwood-v1"
 LogicalFileSize="18561032192" 
PhysicalFileSize="18677760000" 
CommittedVersion="353009" 
LogicalPageSize="8192" 
PhysicalPageSize="8192" 
RemapQueueRecords="498486" 
RemapQueuePages="1940" 
RemapQueueRecordsPerPage="256.952" 
FreeQueueRecords="1265" 
FreeQueuePages="5" 
FreeQueueRecordsPerPage="253" 
DelayedFreeQueueRecords="438" 
DelayedFreeQueuePages="3" 
DelayedFreeQueueRecordsPerPage="146" 
UsedExtentQueueRecords="1" 
UsedExtentQueuePages="2" 
UsedExtentQueueRecordsPerPage="0.5" 
FreeExtentQueueRecords="3" 
FreeExtentQueuePages="4" 
FreeExtentQueueRecordsPerPage="0.75" 
StorageBytesUsed="18547015680" 
StorageBytesTemp="4083597312" 
StorageBytesTotal="51835101184" 
StorageBytesFree="27030654976" 
StorageBytesAvailable="27044671488" 
ThreadID="4701254271508448680" 
Machine="127.0.0.1:4500" 
LogGroup="default" 
Roles="SS" />

UPDATE:
Overnight, the size increase continued, just with a different slope:


![img3|690x309](upload://lgz5Vam61ZSi8JdwUU9yUfvHYoU.png)


<Event Severity="10" Time="1669291648.341558" 
DateTime="2022-11-24T12:07:28Z" 
Type="RedwoodMetrics" 
ID="0000000000000000" Elapsed="5.00003" BTreePreload="35" BTreePreloadExt="0" OpSet="5438" OpSetKeyBytes="166831" OpSetValueBytes="1181612" OpClear="2536" OpClearKey="0" OpGet="5288" OpGetRange="2677" OpCommit="10" PagerDiskWrite="2398" PagerDiskRead="2" PagerCacheHit="37551" PagerCacheMiss="2" PagerProbeHit="1" PagerProbeMiss="0" PagerEvictUnhit="0" PagerEvictFail="4" PagerRemapFree="2287" PagerRemapCopy="1" PagerRemapSkip="2274" LookupGetRPF="35" LookupMeta="31" HitGetRPF="35" HitMeta="30" MissGetRPF="0" MissMeta="0" WriteMeta="53" PageCacheCount="124909" PageCacheMoved="0" PageCacheSize="1073726194" DecodeCacheSize="27075314" L1PageBuild="536" L1PageBuildExt="0" L1PageModify="1158" L1PageModifyExt="60" L1PageRead="11554" L1PageReadExt="270" L1PageCommitStart="2309" L1LazyClearInt="0" L1LazyClearIntExt="0" L1LazyClear="0" L1LazyClearExt="0" L1ForceUpdate="0" L1DetachChild="0" L1LookupCommit="2309" L1LookupLazyClr="0" L1LookupGet="5293" L1LookupGetR="3952" L1HitCommit="2307" L1HitLazyClr="0" L1HitGet="5293" L1HitGetR="3952" L1MissCommit="2" L1MissLazyClr="0" L1MissGet="0" L1MissGetR="0" L1WriteCommit="1754" L1WriteLazyClr="0" L2PageBuild="2" L2PageBuildExt="0" L2PageModify="496" L2PageModifyExt="0" L2PageRead="9735" L2PageReadExt="0" L2PageCommitStart="1675" L2LazyClearInt="0" L2LazyClearIntExt="0" L2LazyClear="0" L2LazyClearExt="0" L2ForceUpdate="35" L2DetachChild="211" L2LookupCommit="1675" L2LookupLazyClr="0" L2LookupGet="5288" L2LookupGetR="2772" L2HitCommit="1675" L2HitLazyClr="0" L2HitGet="5288" L2HitGetR="2772" L2MissCommit="0" L2MissLazyClr="0" L2MissGet="0" L2MissGetR="0" L2WriteCommit="498" L2WriteLazyClr="0" L3PageBuild="0" L3PageBuildExt="0" L3PageModify="84" L3PageModifyExt="0" L3PageRead="8224" L3PageReadExt="0" L3PageCommitStart="259" L3LazyClearInt="0" L3LazyClearIntExt="0" L3LazyClear="0" L3LazyClearExt="0" L3ForceUpdate="82" L3DetachChild="438" L3LookupCommit="259" L3LookupLazyClr="0" L3LookupGet="5288" L3LookupGetR="2677" L3HitCommit="259" L3HitLazyClr="0" L3HitGet="5288" L3HitGetR="2677" L3MissCommit="0" L3MissLazyClr="0" L3MissGet="0" L3MissGetR="0" L3WriteCommit="84" L3WriteLazyClr="0" L4PageBuild="0" L4PageBuildExt="0" L4PageModify="9" L4PageModifyExt="0" L4PageRead="7975" L4PageReadExt="0" L4PageCommitStart="10" L4LazyClearInt="0" L4LazyClearIntExt="0" L4LazyClear="0" L4LazyClearExt="0" L4ForceUpdate="9" L4DetachChild="84" L4LookupCommit="10" L4LookupLazyClr="0" L4LookupGet="5288" L4LookupGetR="2677" L4HitCommit="10" L4HitLazyClr="0" L4HitGet="5288" L4HitGetR="2677" L4MissCommit="0" L4MissLazyClr="0" L4MissGet="0" L4MissGetR="0" L4WriteCommit="9" L4WriteLazyClr="0" L5PageBuild="0" L5PageBuildExt="0" L5PageModify="0" L5PageModifyExt="0" L5PageRead="0" L5PageReadExt="0" L5PageCommitStart="0" L5LazyClearInt="0" L5LazyClearIntExt="0" L5LazyClear="0" L5LazyClearExt="0" L5ForceUpdate="0" L5DetachChild="0" L5LookupCommit="0" L5LookupLazyClr="0" L5LookupGet="0" L5LookupGetR="0" L5HitCommit="0" L5HitLazyClr="0" L5HitGet="0" L5HitGetR="0" L5MissCommit="0" L5MissLazyClr="0" L5MissGet="0" L5MissGetR="0" L5WriteCommit="0" L5WriteLazyClr="0" ThreadID="4701254271508448680" Machine="127.0.0.1:4500" LogGroup="default" Roles="CC,CD,CP,DD,GP,MS,RK,RV,SS,TL" />

Update: overnight, the increase continued, just with a different slope:

Thanks for the update. Can you post bin counts from the Stored histograms for a 4 hour period? It looks like the space usage growth is about 1GB per 24 hours, so this should capture 175MB of growth and if it’s due to slack I would think it would show up there somehow.

Another possibility is leakage of internal space, but there are no known bugs of this form (or any other corruption bugs of any kind). In simulation tests, when a Redwood instance is destroyed it goes through a “destructive sanity check” which ensures that after deleting all data and allowing all deferred operations to complete, with a remap queue of 0, that the BTree is in the expected state of having 1 empty root node and that all other space is accounted for in either the free lists or as part of the internal queue structures themselves.

You can also run this (destructive!) sanity check process on a real data file if you make a consistent copy of it (with fdbserver not running). If you can do this, please

  1. Shut down your storage process so the file is no longer being used.
  2. Copy the .redwood-v1 file to some other directory.
  3. Run this command on the copy (Note: This will delete all data in the file)
    fdbserver -r unittests -f :/redwood/performance/set --test_openExisting=1 --test_insertRecords=0 --test_scans=0 --test_seeks=0 --test_destructiveSanityCheck=1 --test_file=/path/to/copy.redwood-v1
  4. If the command succeeded, then no internal space leakage was found. You can run the command again as a convenient way to reopen the instance and get the RedwoodRecovered trace events.

Thank you, I’ve continued with the investigation, here are my findings:

  • The destructive test ran successfully, so this is not an integrity problem, but a slack problem.
  • The system finally reached a steady state (no size increase) with a slack rate of about 50%. I mean (KV size) / (Total size - 5GB) = ~ 50%

Now, the next thing is to understand and possibly mitigate the high slack rate:

I managed to isolate the part of the workload that I suspected before to cause this, and created a single file Java reproducer: RedwoodReproducer.java · GitHub

Let me explain what workload is generated: By default, running this java application will

  • connect to the default cluster
  • create a directory called “redwood-key-test” if not exist
  • clear that directory
  • will generate 1000 random long (64bit) category identifiers
  • on 10 threads, it will generate records: by default it will generate 13800 records per second evenly spread among the 1000 categories, resulting in about 50 million records in an hour.

The key of each record:
(directory-prefix).(category).(current time in millis rounded up to seconds).(random long number)
The value of each record is a byte array of 52 bytes.

Furthermore, every 20 seconds it will delete older than 1 hour entries for every category in 1000 clearrange operations. As you can see, if you run this program for a little more than 1 hour, it will reach steady state and constant disk usage, as new data gets inserted, old data gets purged.

I think this workload should not generate a lot of slack, since the values are small enough to lots of them to be fit on a single page, and data is closely correlated (category id, increasing date), and removed in ranges.

I even tried the following, with no change in results (47-53% slack):

  • Doubled the size of values from 52 to 104 bytes
  • Instead of 1 hour and 50 million records, configured it to reach steady state with 2 hours and 100M records
  • Ran the delete job less frequently so that it has more chance to delete whole pages 20 sec → 5 minutes

Here is a chart of the build operations after reaching steady state over a a couple of minutes (avg):

lower percentage bins are lower on the chart, I marked the first large bins for L1.

As you have suggested, I checked the Recovered events after the destructive test (on the original database, not the reproducer). After the first destructive test:

<Event Severity="10" Time="1669485569.561169" DateTime="2022-11-26T17:59:29Z" Type="RedwoodRecoveredPager" ID="0000000000000000" OpenedExisting="1" FileName="/root/storage-f87bfbd4641191514656a281b157560d.redwood-v1" 
LogicalFileSize="19988004864" 
PhysicalFileSize="19988480000" 
CommittedVersion="687168" 
LogicalPageSize="8192" 
PhysicalPageSize="8192" 
RemapQueueRecords="498381" 
RemapQueuePages="2076" 
RemapQueueRecordsPerPage="240.068" 
FreeQueueRecords="328380" 
FreeQueuePages="2276" 
FreeQueueRecordsPerPage="144.279" 
DelayedFreeQueueRecords="25" 
DelayedFreeQueuePages="2" 
DelayedFreeQueueRecordsPerPage="12.5" 
UsedExtentQueueRecords="2" 
UsedExtentQueuePages="3" 
UsedExtentQueueRecordsPerPage="0.666667" 
FreeExtentQueueRecords="2" 
FreeExtentQueuePages="3" 
FreeExtentQueueRecordsPerPage="0.666667" 
StorageBytesUsed="17279049728" 
StorageBytesTemp="4082737152" 
StorageBytesTotal="51835101184"
StorageBytesFree="5065433088" 
StorageBytesAvailable="7774388224" ThreadID="18147191374447456872" Machine="0.0.0.0:0" LogGroup="default" Roles="TS" />

<Event Severity="10" Time="1669485569.561169" DateTime="2022-11-26T17:59:29Z" Type="RedwoodRecoveredBTree" ID="0000000000000000" FileName="/root/storage-f87bfbd4641191514656a281b157560d.redwood-v1" OpenedExisting="1" LatestVersion="687168" 
LazyClearQueueRecords="0" 
LazyClearQueuePages="1" 
LazyClearQueueRecordsPerPage="0" ThreadID="18147191374447456872" Machine="0.0.0.0:0" LogGroup="default" Roles="TS" />

After a repeated run:


<Event Severity="10" Time="1669485651.378883" DateTime="2022-11-26T18:00:51Z" Type="RedwoodRecoveredPager" ID="0000000000000000" OpenedExisting="1" FileName="/root/storage-f87bfbd4641191514656a281b157560d.redwood-v1" 
LogicalFileSize="19988004864" 
PhysicalFileSize="19988480000" 
CommittedVersion="688066" 
LogicalPageSize="8192" 
PhysicalPageSize="8192" 
RemapQueueRecords="0" 
RemapQueuePages="1" 
RemapQueueRecordsPerPage="0" 
FreeQueueRecords="2262171" 
FreeQueuePages="5519" 
FreeQueueRecordsPerPage="409.888" 
DelayedFreeQueueRecords="155612" 
DelayedFreeQueuePages="246" 
DelayedFreeQueueRecordsPerPage="632.569" 
UsedExtentQueueRecords="1" 
UsedExtentQueuePages="2" 
UsedExtentQueueRecordsPerPage="0.5" 
FreeExtentQueueRecords="3" 
FreeExtentQueuePages="4" 
FreeExtentQueueRecordsPerPage="0.75" 
StorageBytesUsed="134299648" 
StorageBytesTemp="0" 
StorageBytesTotal="51835101184" 
StorageBytesFree="5063442432" 
StorageBytesAvailable="24917147648" ThreadID="18255384138145159065" Machine="0.0.0.0:0" LogGroup="default" Roles="TS" />

<Event Severity="10" Time="1669485651.378883" DateTime="2022-11-26T18:00:51Z" Type="RedwoodRecoveredBTree" ID="0000000000000000" FileName="/root/storage-f87bfbd4641191514656a281b157560d.redwood-v1" 
OpenedExisting="1" 
LatestVersion="688066" 
LazyClearQueueRecords="0" 
LazyClearQueuePages="1" 
LazyClearQueueRecordsPerPage="0" ThreadID="18255384138145159065" Machine="0.0.0.0:0" LogGroup="default" Roles="TS" />

Do you have any intuition what could cause this slack rate and what parameters can I change in the workload generator to validate the hypothesis?

Update I did a 5 hour test with 5x the data, the slack rate got slightly worse:
Sum of key-value sizes - 18.271 GB
Disk space used - 47.311 GB

So whatever the problem is, is not constant but linear.

@SteavedHams I managed to find the parameter that causes the high slack rate: it is the number of correlation categories. When set from 1000 to just 100, the slack disappears:

Number of categories Record count Threads kv size (GB) db size (GB) variable overhead slack ratio
1000 50M 10 3.924 12.319 99% 50%
1000 250M 10 19.683 49.858 130% 57%
1000 600M 10 45.658 113.06 138% 58%
500 50M 10 3.927 11.205 71% 41%
100 50M 10 3.923 8.824 10% 9% :+1:
100 50M 100 3.507 8.61 17% 15%

(variable overhead calculated with a constant overhead of 4.5GB)

At first I thought that if the less correlation categories get touched in a single transaction that means fewer pages are modified and that is the cause. However, I also set the number of threads to 10x, so in average the same number of pages were modified in a transaction, with minimal change.

I checked this presentation:

So this workload is clearly in the worst case, which I understand performance wise, but I think this should not cause this sub-optimal on-disk structure, given the 100 or 1000 category correlation ids create separate namespaces and should be on entirely different parts on the binary tree. Also one more thing to note is that the removal of old keys can be entirely omitted from the reproducer, since the initial loading (1 hour) itself will create the slack without any data deleted.

Thanks for confirming that this is not an internal space leak.

Based on your workload description I should have realized earlier what was going on here, but it didn’t click for me until you pointed out that the category count affects the slack.

Here’s what is happening and I think I have a configuration fix for you.

First, I should explain that Redwood does not merge pages. This was intentionally omitted (for now) because in the context of a large cluster FDB Data Movement between Storage Servers will remove all slack space from a shard during its move by clearing it at the source and generating maximally filled pages at the destination via large sequential insertions. However, since some shards may not move for long periods of time, as a fallback FDB has a feature called the Perpetual Storage Wiggle which will safely exclude and re-add Storage Servers, one at a time, once they reach some maximum age which defaults to 3 weeks. Of course, for a cluster with 1 Storage Server there is no Data Movement so everything stays in place.

As pages fill up, they must eventually must split. When a page splits (whether due to adding 1 byte or millions) the process is to build sequential pages with REDWOOD_PAGE_REBUILD_MAX_SLACK in slack space and then try to balance space between the last two pages in the split set. In the case of gradually filling a page, the split set is just 2 pages.

What is going wrong here is that the balancing logic will shift records from the second to last page of the set to the last page of the set so long as the last page slack is > REDWOOD_PAGE_REBUILD_MAX_SLACK. With the default value of 33%, this is actually shifting more records to the right-hand side of a 2-way split, leaving the left side with up to 66% slack.

If within some key range, such as under a Category prefix, your only updates are either to insert new highest key(s) or to remove lowest key(s), then the left side page of the 2-way split on insertion remains under-filled and untouched until it is eventually completely cleared. Each new right side of a 2-way split eventually becomes the left side of the next 2-way split under that prefix range, which leads to the slack space steady state you observe.

I think the reason that lowering your Category prefix count by 10x reduces the slack is that now you are inserting enough data under a single Category in one Storage Server commit cycle (which is every 250ms or 10MB, whichever comes first, and it doesn’t matter how many different clients/threads/transactions produced the sets/clears) that you are doing >2-way splits so you are leaving behind some very filled pages which mitigates the effect of the under-filled second to last pages.

The reason all of this was not apparent from the stats is that that only pages that are touched during update are reported on, so an under-filled untouched page is not.

Redwood’s split logic could be better here. The balancing part was added because not balancing between the last two pages could have a worse outcome, where you keep making small inserts on the left and generating many single-record pages on the right. But the balance % should be a different setting and should default to 50%. This of course still won’t be ideal for your workload. I do plan to add some kind of page merging in the future but I want to avoid anything that would allow certain update patterns to cause split/merge/split/merge thrashing.

Since your records are known to be far smaller than a page, the page-upsizing logic I mentioned previously won’t be active, so the knob is only affecting the balance between the last two post-split pages. Therefore, you should see lower slack with a higher value of this setting (counter-intuitive, I realize) because it will leave more slack on the right side of 2-way splits. So please try adding

knob_redwood_page_rebuild_max_slack = .90

to your foundationdb.conf file. You could also try a value of 1.0 which will leave all slack on the right side of a 2-way split.

Thank you Steve for the detailed insights into Redwood! The configuration change indeed fixed my problem!

I think that the REDWOOD_PAGE_REBUILD_MAX_SLACK controls two almost independent parameters, as seen in the VersionedBTreeActor’s splitPages method:

  • Whether or not an existing page should be expanded and the record inserted into an existing page based on the existing slack ratio of the existing page and the new record not fitting
  • The (anti) filling ratio of the new page in case of a page split from the existing page.

I think the 50% ratio you mentioned would be a sensible default value for the latter. I created a patch with a new knob: https://github.com/imperatorx/foundationdb/commit/238287da20df33612f71ca861828b58bc6314e4c and did some experimenting:

As you can see, the the workaround made the slack decrease from 66% to 36% even in a smallish test. I can see even better gains (close to 0% calculated slack thanks to value compression) on the test server with the original workload with REDWOOD_PAGE_REBUILD_MAX_SLACK set to .9.

When the new knob is set to 0, all slack remains in the old page, so as expected, the system generates runaway slack and storage efficiency converges to 0%.

When the new knob is set to .33 (mimics behavior before patch), the slack converges to 66% as before, which is expected.

When the new knob is 0.5 or less, the small tests produce 33% or less slack. The only thing I can’t make sense of the small difference between 0.5 and 1, but it is probably related to some other overhead, possibly 4 page worth of slack in non-leaf pages, or me not properly assessing the size of the static buffer overheads.

I think a knob like this should be introduced, or at least the second variable should be set to static value of 0.5, to support users using keys increasing by some time value (like twitter snowflake style ids with first bits set to partition ids to avoid storage node contention).

Also, what is your opinion on using 16 byte Type4 Tandom UUIDs as keys in Redwood (with the assumption of the new setting being 0.5?

Glad to see your results match expectations! Your patch implements what I alluded to above

the balance % should be a different setting and should default to 50%

which I haven’t done yet (would you like to submit a PR?) but I also had an idea for detection of always-greatest insertion automatically with a trivial cost so that balancing could be automatically biased for at least the purely increasing insertion pattern.

I can see even better gains (close to 0% calculated slack thanks to value compression) on the test server with the original workload with REDWOOD_PAGE_REBUILD_MAX_SLACK set to .9.

To be clear Redwood only has key prefix compression, not value, (but I suspect that’s what you meant) and yes I would expect that aside from the ~4.5GB of relatively fixed overhead your time based queue-like pattern should be able to achieve near 0% slack or perhaps <0% if the keys were long and prefix-compressible enough.

Also, what is your opinion on using 16 byte Type4 Tandom UUIDs as keys in Redwood (with the assumption of the new setting being 0.5?

This will cause a random update pattern of course, but it should result in pages being somewhere between 50% full (if they are new) and 100% full (if they are close to splitting) so overall slack should be somewhere in that range. I think in a uniform random insert pattern there would be a high correlation in the fill progresses of many pages so overall slack might swing between these extremes as the BTree grows? This would be an interesting experiment.

I created a PR but CI is complaining about formatting, but the changes are fairly trivial and I ran the clang-format too: