Storage process slowly growth until oom

Hello everyone,

We are running a three-node FoundationDB cluster as the key-value backend in our production environment.
On each machine, we have deployed one storage process, one transaction process, and two stateless processes.
The redundancy mode is set to double, and each machine has 4 cores and 16 GB RAM.
We are using FoundationDB version 7.3.6, and the storage engine is ssd-2.

The cluster was started on December 26, 2025. Around February 5, 2026, we observed that all storage processes restarted, most likely due to an out-of-memory (OOM) condition.
All configurations are using default values — memory is set to 8 GB, and cache-memory to 2 GB.

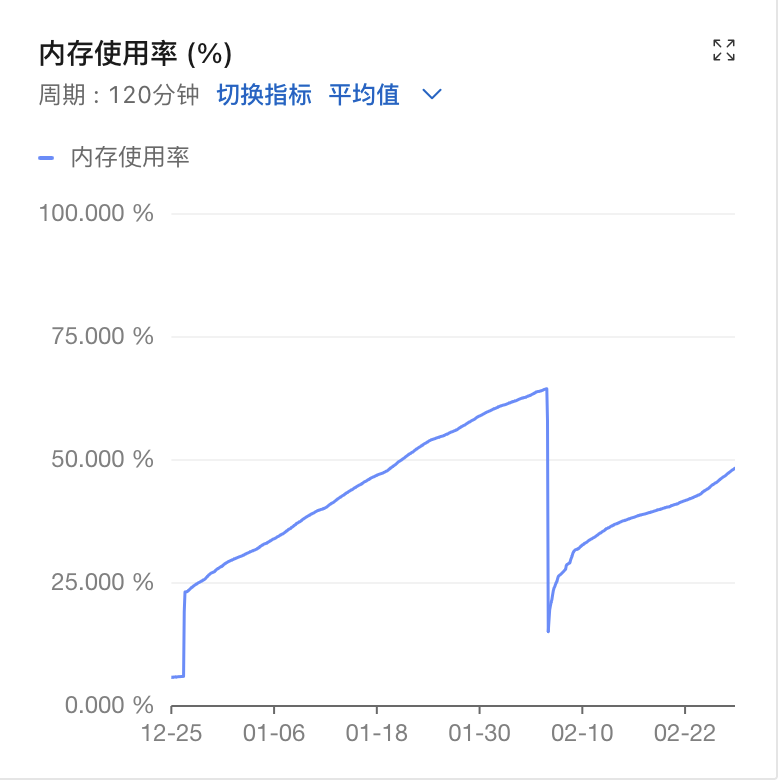
From system-level monitoring, we saw that memory usage per machine started at around 2 GB, then gradually and steadily increased to about 10 GB over the course of approximately 30 days.
Shortly after reaching that peak, memory usage dropped sharply back to 2 GB, which we believe corresponds to the moment the storage processes self-killed and restarted.

We have confirmed that the memory growth was driven by the storage processes, but we’re still trying to understand why the memory usage increased in such a pattern over time.

We would greatly appreciate any insights, suggestions, or similar experiences from the community!

Thanks a lot in advance!

system monitor

2026-2-28 storage process trace log

<Event Severity="10" Time="1772274700.209555" DateTime="2026-02-28T10:31:40Z" Type="MemoryMetrics" ID="0000000000000000" TotalMemory16="0" ApproximateUnusedMemory16="0" ActiveThreads16="0" TotalMemory32="262144" ApproximateUnusedMemory32="0" ActiveThreads32="1" TotalMemory64="23330816" ApproximateUnusedMemory64="1048576" ActiveThreads64="4" TotalMemory96="99066240" ApproximateUnusedMemory96="1179360" ActiveThreads96="1" TotalMemory128="1048576" ApproximateUnusedMemory128="786432" ActiveThreads128="1" TotalMemory256="102105088" ApproximateUnusedMemory256="655360" ActiveThreads256="2" TotalMemory512="0" ApproximateUnusedMemory512="0" ActiveThreads512="0" TotalMemory1024="0" ApproximateUnusedMemory1024="0" ActiveThreads1024="0" TotalMemory2048="0" ApproximateUnusedMemory2048="0" ActiveThreads2048="0" TotalMemory4096="0" ApproximateUnusedMemory4096="0" ActiveThreads4096="0" TotalMemory8192="0" ApproximateUnusedMemory8192="0" ActiveThreads8192="0" TotalMemory16384="0" ApproximateUnusedMemory16384="0" ActiveThreads16384="0" HugeArenaMemory="408767" DCID="[not set]" ZoneID="3fdfebb73ecc1933e38ca1e879b98592" MachineID="3fdfebb73ecc1933e38ca1e879b98592" ThreadID="7245411346491657398" Machine="172.17.12.179:4502" LogGroup="default" Roles="SS" /> <Event Severity="10" Time="1772274700.209555" DateTime="2026-02-28T10:31:40Z" Type="FastAllocMemoryUsage" ID="0000000000000000" TotalMemory="225812864" UnusedMemory="3669728" Utilization="98.374881%" ThreadID="7245411346491657398" Machine="172.17.12.179:4502" LogGroup="default" Roles="SS" />

<Event Severity="10" Time="1772274701.447430" DateTime="2026-02-28T10:31:41Z" Type="StorageMetrics" ID="213805d2f370b324" Elapsed="5.00002" QueryQueue="33.3999 4.15153 171995160" SystemKeyQueries="8.79997 2.52402 17547322" GetKeyQueries="0 -1 0" GetValueQueries="25.3999 11.5577 156341001" GetRangeQueries="7.99997 2.52972 15654159" GetRangeSystemKeyQueries="7.99997 2.52972 15652033" GetRangeStreamQueries="0 -1 0" FinishedQueries="33.3999 4.15153 171995160" LowPriorityQueries="0 -1 0" RowsQueried="37.3999 20.0488 176617914" BytesQueried="72563.9 40838.4 611708191952" WatchQueries="0.399999 0.0137521 882110" EmptyQueries="6.79998 1.84444 14873490" FeedRowsQueried="0 -1 0" FeedBytesQueried="0 -1 0" FeedStreamQueries="0 -1 0" RejectedFeedStreamQueries="0 -1 0" FeedVersionQueries="0 -1 0" GetMappedRangeBytesQueried="0 -1 0" FinishedGetMappedRangeSecondaryQueries="0 -1 0" GetMappedRangeQueries="0 -1 0" FinishedGetMappedRangeQueries="0 -1 0" BytesInput="7033.98 16322.4 124724490636" LogicalBytesInput="2799.39 6495.4 56776772565" LogicalBytesMoveInOverhead="0 -1 0" KVCommitLogicalBytes="45934.8 38738.1 56942200147" KVClearRanges="0 -1 254941" KVClearSingleKey="0 -1 373" KVSystemClearRanges="0 -1 4563" BytesDurable="95330.9 140470 124724433608" BytesFetched="0 -1 79324813" MutationBytes="2818.99 6540.89 56910837433" FeedBytesFetched="0 -1 0" SampledBytesCleared="0 -1 315762867" KVFetched="0 -1 13326" Mutations="1.4 2.2489 9576062" SetMutations="1.2 1.78477 9325592" ClearRangeMutations="0.199999 0 250470" AtomicMutations="0 -1 0" ChangeFeedMutations="0 -1 0" ChangeFeedMutationsDurable="0 -1 0" UpdateBatches="1.59999 0.585213 13777105" UpdateVersions="1.2 1.78477 9310340" Loops="12.2 0.165448 32202027" FetchWaitingMS="0 -1 0" FetchWaitingCount="0 -1 3" FetchExecutingMS="0 -1 24375" FetchExecutingCount="0 -1 3" ReadsRejected="0 -1 0" WrongShardServer="0 -1 22" FetchedVersions="968405 959457 1765889397426" FetchesFromLogs="1.59999 0.585213 13777105" QuickGetValueHit="0 -1 0" QuickGetValueMiss="0 -1 0" QuickGetKeyValuesHit="0 -1 0" QuickGetKeyValuesMiss="0 -1 0" KVScanBytes="3816.99 6467.86 6436252080" KVGetBytes="56683.2 40787.8 357846737396" EagerReadsKeys="0.199999 0 250470" KVGets="21.1999 9.61561 121578464" KVScans="8.19997 2.5283 15904748" KVCommits="1.4 0.180683 2861581" ChangeFeedDiskReads="0 -1 0" ChangeServerKeysAssigned="0 -1 51" ChangeServerKeysUnassigned="0 -1 3" PTreeSets="1.2 1.78477 9325554" PTreeClears="0.199999 0 250470" PTreeClearSplits="0 -1 2465" LastTLogVersion="6399863978869" Version="6399863978869" StorageVersion="6399858978869" DurableVersion="6399858978869" DesiredOldestVersion="6399858978869" VersionLag="1087965" LocalRate="100" BytesReadSampleCount="0" FetchKeysFetchActive="0" FetchKeysWaiting="0" FetchKeysChangeFeedFetchActive="0" FetchKeysFullFetchWaiting="0" ServeFetchCheckpointActive="0" ServeFetchCheckpointWaiting="0" ServeValidateStorageActive="0" ServeValidateStorageWaiting="0" QueryQueueMax="3" BytesStored="5116112283" ActiveWatches="13" WatchBytes="29874" KvstoreSizeTotal="0" KvstoreNodeTotal="0" KvstoreInlineKey="0" ActiveChangeFeeds="0" ActiveChangeFeedQueries="0" ChangeFeedMemoryBytes="0" StorageEngine="ssd-2" Tag="0:2" ReadsTotalActive="0" ReadsTotalWaiting="0" ReadFetchActive="0" ReadFetchWaiting="0" ReadLowActive="0" ReadLowWaiting="0" ReadNormalActive="0" ReadNormalWaiting="0" ReadHighActive="0" ReadHighWaiting="0" KvstoreBytesUsed="6743695360" KvstoreBytesFree="205506711552" KvstoreBytesAvailable="205506711552" KvstoreBytesTotal="214641414144" KvstoreBytesTemp="0" ThreadID="7245411346491657398" Machine="172.17.12.179:4502" LogGroup="default" Roles="SS" TrackLatestType="Original" />

FDB uses a custom memory allocator FastAllocator (see Memory Considerations · apple/foundationdb Wiki · GitHub), which reports different block’s memory usage in MemoryMetrics events. You might want to graph TotalMemory field over time to see if FastAllocator is gradually using more memory. If so, the behavior is expected, because FastAllocator does not return free pages back to the OS (for memory usage efficiency). Then I’d recommend increase memory size of SS roles. Note not all memory is consumed by FastAllocator.

There are other possibilities. For instance, we found disable transparent huge page is needed when using RHEL9 fdbserver 7.x on sqlite OOM on RHEL9 · apple/foundationdb Wiki · GitHub

Debug Out Of Memory (OOM) Errors in Simulation and Production · apple/foundationdb Wiki · GitHub mentioned two more trace events to check: GetMagazineSample and HugeArenaSample.

Thank you very much for your reply!

  1. From the TotalMemory values in the production environment logs, I observed that Fastalloc only uses about 2GB of memory, even though the overall memory usage of storage is 6.7GB. As the process memory increases, TotalMemory does not show significant changes.

  2. In the test environment, I used jeprof to observe jemalloc’s allocation. When the process memory increased, neither jemalloc nor Fastalloc showed any changes in memory usage.

  3. Regarding HugeArenaSample, I observed in the logs that its maximum size was only 31KB. Additionally, no GetMagazineSample output was found in the logs.

  4. With the help of AI, I analyzed the code and speculated that the SQLite B-Tree might be using a large amount of memory, as I noticed there is no limit on the memory usage of the B-Tree. Is this possible?

  5. I will make further efforts to resolve the issue.

Thank you again for your response! If you have any suggestions or questions, I would appreciate it if you could point them out.