I’m in the process of trying to optimize the bulk import of our data restore tool, and I’m having trouble understanding what’s happening under certain circumstances. To help me, I’ve added support for all the new metrics available in status json in the recent versions, and it is showing me something unexpected.
I have a small cluster with 3 hosts (ubuntu 18.04) and 5 processes each, splitted into stateless, strorage and log classes in order to maximize memory and disk usage per host. Two NVME ssd per host, one for the log, the other for the storage
Overview of the cluster topology:
note: sorry for the mess, still work in progress I’m not sure which metric is usefull where, so it’s a bit random
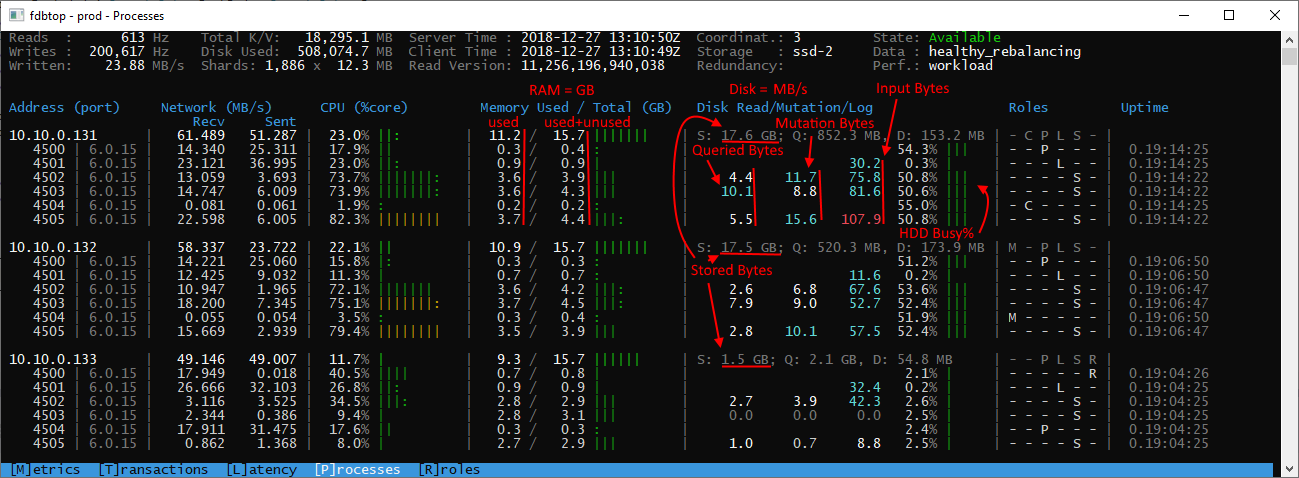
When running the import tool, it is maxxing out at 10 to 20 MB/s (~25 GB to import total). I’ve doubled the throughput by changing the import from sequential to ‘random’ order, but I’m still seeing weird hotspots in the storage nodes:
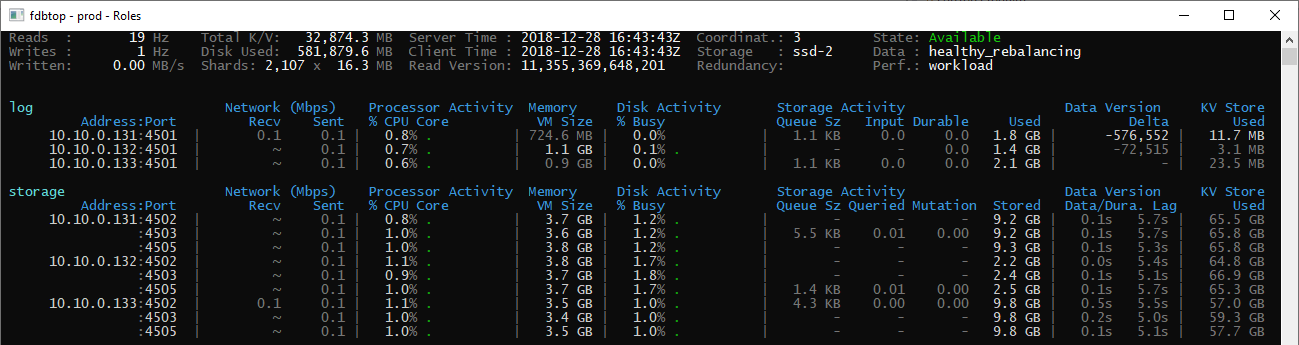
View of log and storage roles:
again, work in progress, need to find the best way to display things in this tab

You can see that in the list of storage roles, almost all the process on host .131 and .132 are at 75-85% CPU, and have 2.x GB data each (at the time of the screenshot), while the host .133 has only ~230 MB of stored_bytes, and is doing nothing (cpu, %disk, network, …).
Is this expected? I’ve run the import multiple times, and I always see the same pattern: all the data a concentrated on the first twho hosts, and the third host does not see much action.
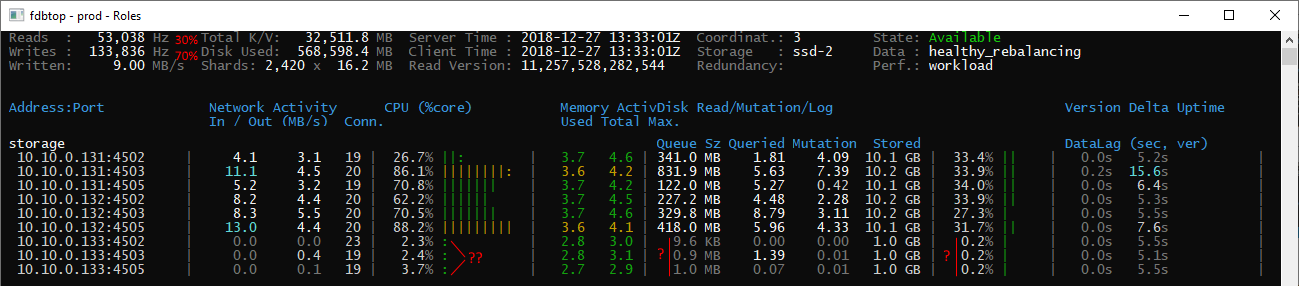
Edit: at a later stage in the import process, the load is about 33% read 66% write and I’m still seeing the same imbalance (though it is expected if all the data is on host 1 and 2)
Edit 2 and this is the same cluster after being idle for ~20 hours
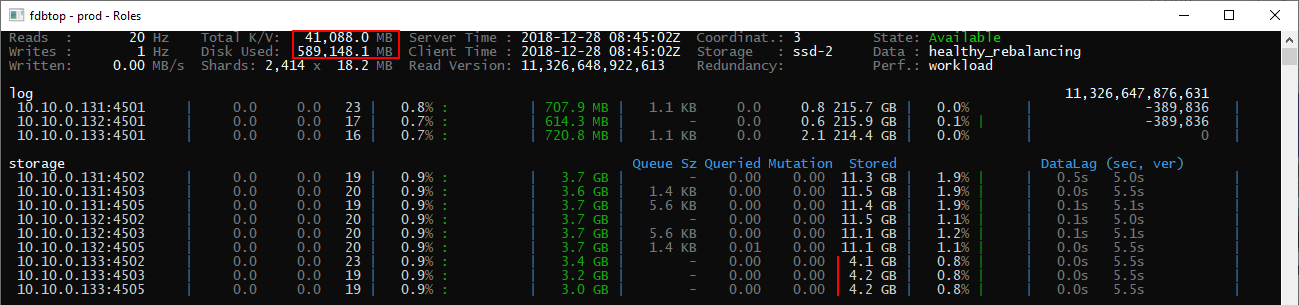
There is slightly more data on the 3rd host now, but still imabalanced. It is only storing 15% of the data instead of expected 33%.