I’m trying to address an issue right now with the MachineMetrics coming out negative in FreeBSD. I found a couple of problems with the code I have so far (format is different, need to poll all cores) but just need to know if I’m looking at the right thing. From what I can tell testing in Docker and going through the code the CPUSeconds for MachineMetrics are calculated by this:
getMachineLoad(clockIdleTime, clockTotalTime);
returnStats.machineCPUSeconds = clockTotalTime - (*statState)->lastClockTotalTime != 0 ? ( 1 - ((clockIdleTime - (*statState)->lastClockIdleTime) / ((double)(clockTotalTime - (*statState)->lastClockTotalTime)))) * returnStats.elapsed : 0;
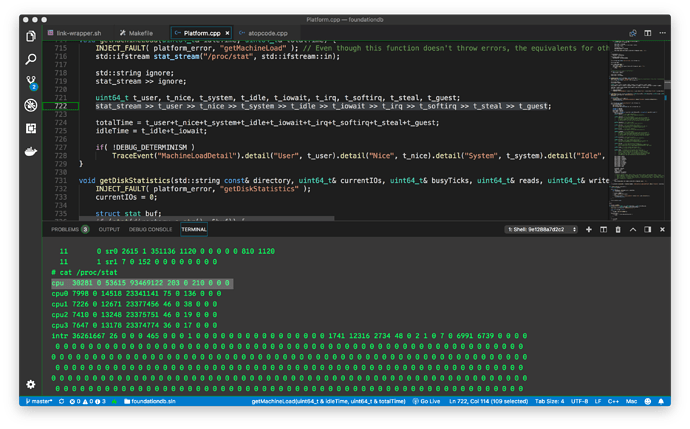
Pulling this up in Docker for VSCode I can see on my VM 4 cores are polled and values are totaled:
I’m getting a negative 3 digit number as time progresses but those numbers as uint64_t do increment over time slightly since they are a metric of time. The test code which I use (which is now just on 1 core still for simplicity’s sake) to see this in a console application is as follows:
util = (100ULL * cur[CP_USER] / (sum ? (double)sum : 1.0L));
printf("cpu user utilization: %7.3f\n", util);
util = (100ULL * cur[CP_NICE] / (sum ? (double)sum : 1.0L));
printf("cpu nice utilization: %7.3f\n", util);
util = (100ULL * cur[CP_SYS] / (sum ? (double)sum : 1.0L));
printf("cpu sys utilization: %7.3f\n", util);
util = (100ULL * cur[CP_IDLE] / (sum ? (double)sum : 1.0L));
printf("cpu idle utilization: %7.3f\n", util);

printf("User in uint64_t: %ju\n", (uint64_t)(cur[CP_USER] * 100ULL));
printf("Nice in uint64_t: %ju\n", (uint64_t)(cur[CP_NICE] * 100ULL));
printf("System in uint64_t: %ju\n", (uint64_t)(cur[CP_SYS] * 100ULL));
printf("Idle in uint64_t: %ju\n", (uint64_t)(cur[CP_IDLE] * 100ULL));
The modifier at the end is just to make it equivalent to /proc/stat and there are some other methods to make them the same but I notice that the numbers are incrementing and “system” is too large- the output is:
cpu user utilization: 0.161
cpu nice utilization: 0.000
cpu sys utilization: 0.591
cpu idle utilization: 98.974
User in uint64_t: 28900
Nice in uint64_t: 0
System in uint64_t: 106100
Idle in uint64_t: 17782400
cpu user utilization: 0.161
cpu nice utilization: 0.000
cpu sys utilization: 0.591
cpu idle utilization: 98.974
User in uint64_t: 28900
Nice in uint64_t: 0
System in uint64_t: 106100
Idle in uint64_t: 17782400
cpu user utilization: 0.161
cpu nice utilization: 0.000
cpu sys utilization: 0.591
cpu idle utilization: 98.973
User in uint64_t: 29000
Nice in uint64_t: 0
System in uint64_t: 106200
Idle in uint64_t: 17796600
Alright, so you get the idea and working on fixing up the number conversion so it’s better but the ratios of the CPU are accurate and have definitely tested to see if that’s correct.
My question is- should CPUSeconds usually come out as 0 and how? The way I read the code is that it compares the time values and if they are different then output the calculated length of time between ProcessMetrics calls. Wouldn’t that always normally output a value? Also, is this the correct place to be testing things? I’ve tried modifying a few things here and there and seem to get the same negative 3 digit number.
