The cluster consists of 35 nodes, each with 2 CPU cores and 8 GB of memory. Each node runs one fdbserver. Among them, there are 18 storage processes, 4 transaction processes, 1 grv_proxy, 3 commit_proxies, and 3 coordinator nodes; the rest are set to 1 process each. The database is initialized with triple replication, the storage engine is ssd-redwood-1, and each node’s configuration file was initialized as follows.
[fdbmonitor]
user = foundationdb
group = foundationdb
[general]
restart_delay = 60
cluster_file  = /etc/foundationdb/fdb.cluster
[fdbserver]
command        = /usr/sbin/fdbserver
public_address = ${SELF_IP}:${FDB_PORT}
listen_address = 0.0.0.0:${FDB_PORT}
datadir        = /data0/foundationdb/data/${FDB_PORT}
logdir         = /data0/foundationdb/log
memory         = 7GiB
cache-memory  =  4GiB
logsize = 10MiB
maxlogssize = 100MiB
memory-vsize = 0
locality-zoneid = ${CNP_ZONE}-${SELF_IP}
locality-data-hall = ${CNP_REGION}
io-trust-seconds = 20
[fdbserver.${FDB_PORT}]
class = ${FDB_CLASS_DEFAULT}During the YCSB benchmark, the key size was set to 128 and the value size to 1024. There were 3 clients, and each client ran the following workload:
During the YCSB benchmark, the key size was set to 128 and the value size to 1024. There were 3 clients, and each client ran the following workload:
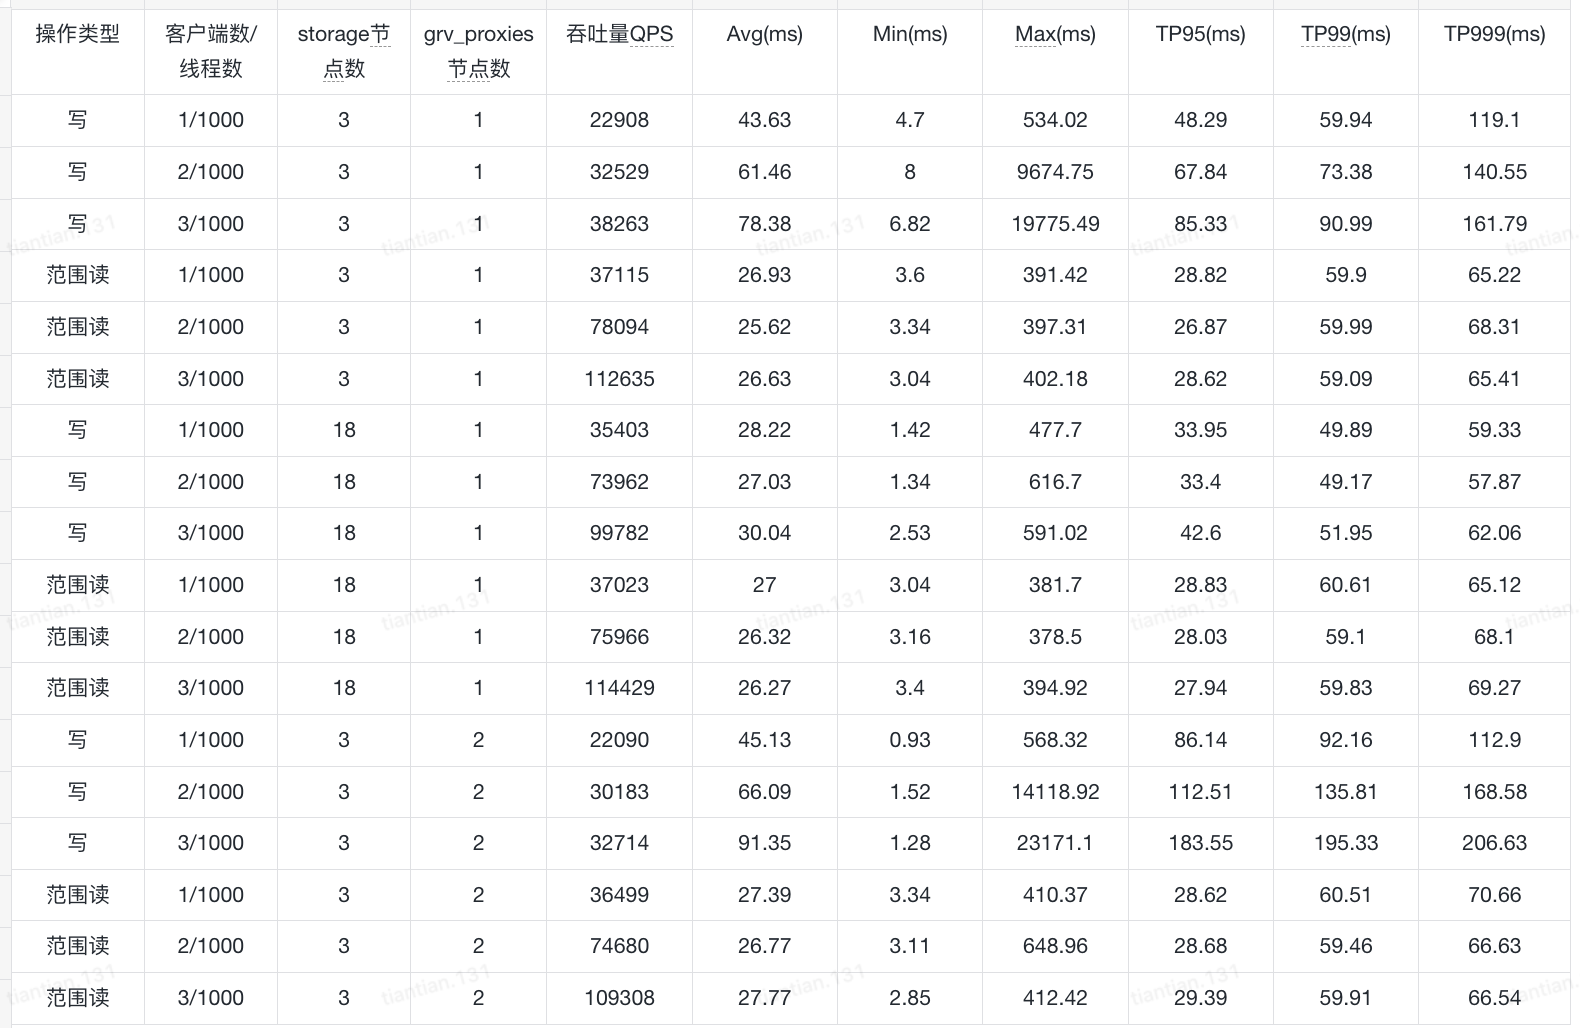
The benchmark results are shown below. Why is it that neither adding more storage processes nor adding more grv_proxies achieves the linear scaling shown in the official documentation? How should I configure the system to improve throughput, and which role should I expand for testing?
Feel free to hit us up on Discord (where I believe you’ll get help faster). Seems like your range reads are scaling linearly but not the writes so the question would be whether you scaled up your tlogs during the benchmark (linearly as well)? You can also see what’s being saturated if you separate the roles by pinning them onto processes. Running a bank of storage-only processes, tlogs-only processes and stateless-only processes and then setting the counts of each role (which then gets mapped to them) is critical to understand what’s the bottleneck during a benchmark. That and also of course, dumping fdbcli output as json regularly during the run.
We specified process classes in the .conf file, which would assume different roles, preventing a single node from assuming multiple roles. We then increased the number of specific roles for benchmarking. However, we encountered a problem. After scaling up the stoarge nodes to 1,000, the transaction count to 50, the resolution count to 10, the grv-proxy count to 50, the commit-proxy count to 50, and the stateless count to 10, the status displayed the following message for ten hours without changing, with the disk space used continuously increasing:
fdb> status

Using cluster file `/etc/foundationdb/fdb.cluster'.

Configuration:
  Redundancy mode        - triple
  Storage engine         - ssd-2
  Log engine             - ssd-2
  Encryption at-rest     - disabled
  Coordinators           - 5
  Desired Commit Proxies - 50
  Desired GRV Proxies    - 50
  Desired Resolvers      - 10
  Desired Logs           - 50
  Usable Regions         - 1

Cluster:
  FoundationDB processes - 1170
  Zones                  - 1170
  Machines               - 1170
  Memory availability    - 7.0 GB per process on machine with least available
  Fault Tolerance        - 2 zones
  Server time            - 09/25/25 09:56:14

Data:
  Replication health     - (Re)initializing automatic data distribution
  Moving data            - unknown (initializing)
  Sum of key-value sizes - unknown
  Disk space used        - 1.317 TB
After checking the “status json”, I found that data_distributor frequently switches between stateless processes, and the CPU usage is almost always above 90%. What is causing this problem? How can I solve this problem and restore the database to a healthy state?
That is a lot of fdbserver processes, you said 35 nodes in the first message, now you’re up to 1k. Was it scaling linearly before you went to 1k storage nodes? The numbers for commit proxies, GRV proxies, resolvers and logs seem arbitrary as well. My suggestion would be to check for saturation for each of the roles as you scale up your qps (note that fdb can take spikes until SS lags so you want to test sustained throughput). Once you understand how the YCSB workload (in terms of write qps) relates to each role, you should see sub-linear scaling when you increase the number of processes w.r.t. write qps.
Also, with that number of processes, linux/kernel tuning becomes a thing. You might want to check your syslog and definitely make sure you’re using the latest network drivers (even if you are running on cloud).