The cluster consists of 35 nodes, each with 2 CPU cores and 8 GB of memory. Each node runs one fdbserver. Among them, there are 18 storage processes, 4 transaction processes, 1 grv_proxy, 3 commit_proxies, and 3 coordinator nodes; the rest are set to 1 process each. The database is initialized with triple replication, the storage engine is ssd-redwood-1, and each node’s configuration file was initialized as follows.
[fdbmonitor]
user = foundationdb
group = foundationdb
[general]
restart_delay = 60
cluster_file  = /etc/foundationdb/fdb.cluster
[fdbserver]
command        = /usr/sbin/fdbserver
public_address = ${SELF_IP}:${FDB_PORT}
listen_address = 0.0.0.0:${FDB_PORT}
datadir        = /data0/foundationdb/data/${FDB_PORT}
logdir         = /data0/foundationdb/log
memory         = 7GiB
cache-memory  =  4GiB
logsize = 10MiB
maxlogssize = 100MiB
memory-vsize = 0
locality-zoneid = ${CNP_ZONE}-${SELF_IP}
locality-data-hall = ${CNP_REGION}
io-trust-seconds = 20
[fdbserver.${FDB_PORT}]
class = ${FDB_CLASS_DEFAULT}During the YCSB benchmark, the key size was set to 128 and the value size to 1024. There were 3 clients, and each client ran the following workload:
During the YCSB benchmark, the key size was set to 128 and the value size to 1024. There were 3 clients, and each client ran the following workload:
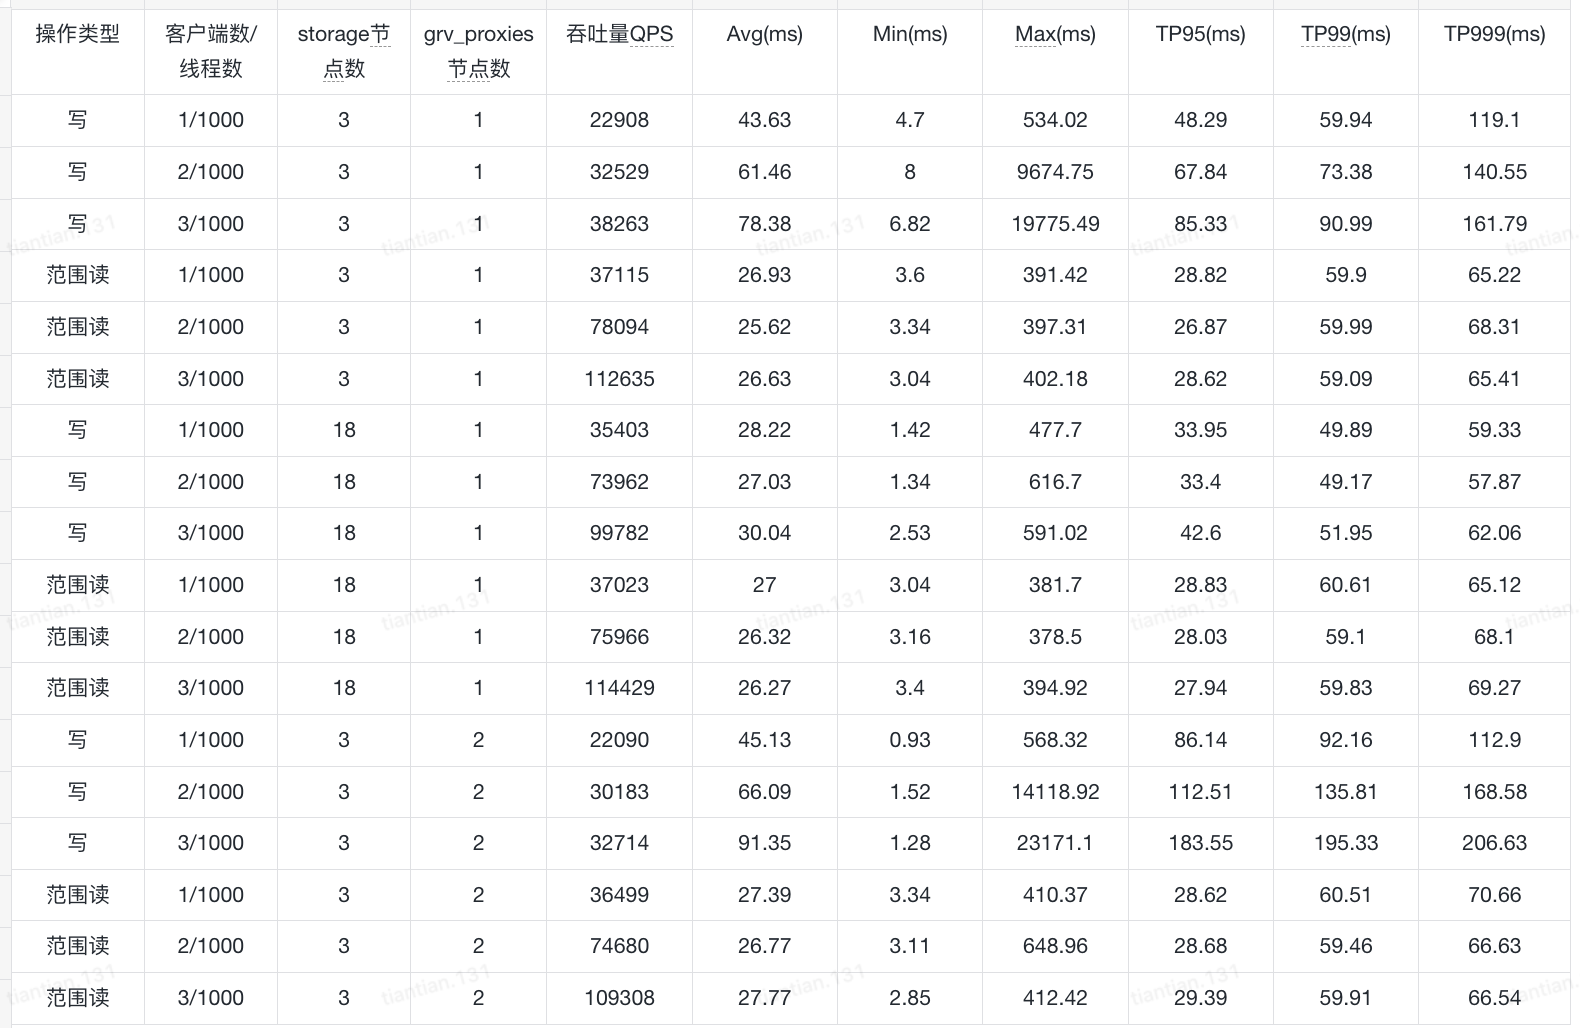
The benchmark results are shown below. Why is it that neither adding more storage processes nor adding more grv_proxies achieves the linear scaling shown in the official documentation? How should I configure the system to improve throughput, and which role should I expand for testing?
Can you add a pointer to the ‘official documentation’ you refer to please? I see QPS rises w/ client count (if I read that right). 1000 threads seems like a lot in a single java process. Perhaps try with less (How much heap was the client running with? Are the clients using any CPU?). Any metrics on FDB processes you want to share or observations on how the cluster is doing while under load?
Subsequently, we modified the cluster configuration to 100 storage processes, 10 transaction processes, 10 GRV proxies, 10 commit proxies, and 3 coordinator nodes. We conducted YCSB stress tests with the same 3 clients and 1,000 threads, but the cluster performance did not increase with the addition of more roles—it remained roughly the same as the data shown in the table.
Later, we scaled the client size to 30, with each client running 10 YCSB programs for testing. The read-write mix was 7:3, and the highest QPS achieved was 1.8 million per second.
Regarding the cluster load, we parsed the files obtained from the “status json” and derived a series of cluster metrics. However, there are too many metrics to analyze easily. Could you please advise which metrics we should focus on in this situation?
We scaled the client size to 20, with each client running 10 YCSB programs for testing under a 7:3 read-write mix. The peak QPS reached 1.75 million per second. After further scaling the client size to 30, the QPS reached 1.872 million per second, with a P99 latency around 250 ms.
Hello, we specified process classes in the .conf file, which would assume different roles, preventing a single node from assuming multiple roles. We then increased the number of specific roles for benchmarking. However, we encountered a problem. After scaling up the stoarge nodes to 1,000, the transaction count to 50, the resolution count to 10, the grv-proxy count to 50, the commit-proxy count to 50, and the stateless count to 10, the status displayed the following message for ten hours without changing, with the disk space used continuously increasing:
fdb> status

Using cluster file `/etc/foundationdb/fdb.cluster'.

Configuration:
  Redundancy mode        - triple
  Storage engine         - ssd-2
  Log engine             - ssd-2
  Encryption at-rest     - disabled
  Coordinators           - 5
  Desired Commit Proxies - 50
  Desired GRV Proxies    - 50
  Desired Resolvers      - 10
  Desired Logs           - 50
  Usable Regions         - 1

Cluster:
  FoundationDB processes - 1170
  Zones                  - 1170
  Machines               - 1170
  Memory availability    - 7.0 GB per process on machine with least available
  Fault Tolerance        - 2 zones
  Server time            - 09/25/25 09:56:14

Data:
  Replication health     - (Re)initializing automatic data distribution
  Moving data            - unknown (initializing)
  Sum of key-value sizes - unknown
  Disk space used        - 1.317 TB
After checking the “status json”, I found that data_distributor frequently switches between stateless processes, and the CPU usage is almost always above 90%. What is causing this problem? How can I solve this problem and restore the database to a healthy state?
I’m a little suspicious that since you lowered the memory ceiling from the recommended 8GB to 7GB, your data distributor is probably OOMing itself because all the memory tuning knobs within FDB are set assuming 8GB available per process. I’d suggest sticking with the 8GB, and if you find that you need to feed it more than 8GB for it to stop OOMing that’s worth filing a bug over.
Also note that desired != actual. It’d be good to double check from status json how many of which roles were actually recruited based upon your cluster.
I’d also expect that you’d need to run more clients than transaction subsystem processes. Do check your client FDB Network Thread CPU utilization, and either change your YCSB tester to use client_threads_per_version to run multiple FDB network threads (and then round-robin requests across multiple database objects, or partition threads to databases, or something), or just run more YCSB testers that are set to run less QPS per client.
Also be aware that YCSB testing for FoundationDB will be less representative of real workloads than it might be for other key-value stores. FoundationDB has a higher fixed cost for starting a transaction as part of the GetReadVersion call, and YCSB implementations typically do one read or one write per transaction.
I’d make sure that you can first get something that looks like a reasonable saturation and throughput on a small cluster to figure out the about right ratio of log:storage, grv/commit proxies, and number of clients for your benchmark, and then scale up at full multiples.
Would cause the key-value pairs to be written ordered by the key, likely causing all writes to hit the same storage processes. I.e. the write load would not be evenly distributed across the processes.
Yes, we have tried using insertorder=hashed, but the performance was basically the same — we didn’t observe any significant improvement compared to the default setting.